Use the kidney function calculator
Enter age, sex, and serum creatinine to estimate eGFR and CKD stage. Optionally add ACR for KDIGO risk classification and BSA for absolute GFR.
eGFR
59.3 mL/min/1.73 m²
Estimated GFR
59.3 mL/min/1.73 m²
Estimated GFR (CKD-EPI 2021)
59.3 mL/min/1.73 m²
Mild–moderate decrease — approximately 49% of typical kidney filtering capacity
CKD Stage
G3a
Mild–moderate decrease
eGFR Range
45–59
mL/min/1.73 m²
Absolute GFR
—
Enable BSA above
KDIGO CKD Risk Classification
| GFR Stage | eGFR | A1 (<30) | A2 (30–300) | A3 (>300) |
|---|---|---|---|---|
| G1 | ≥ 90 | Low | Moderate | High |
| G2 | 60–89 | Low | Moderate | High |
| G3a | 45–59 | Moderate | High | Very High |
| G3b | 30–44 | High | Very High | Very High |
| G4 | 15–29 | Very High | Very High | Very High |
| G5 | < 15 | Very High | Very High | Very High |
Your position is highlighted when ACR is entered. Risk levels: Low, Moderate, High, Very High.
CKD Stages by eGFR
| Stage | eGFR (mL/min/1.73 m²) | Description |
|---|---|---|
| G1 | ≥ 90 | Normal or high |
| G2 | 60–89 | Mildly decreased |
| G3a | 45–59 | Mild–moderate ← You |
| G3b | 30–44 | Moderate–severe |
| G4 | 15–29 | Severely decreased |
| G5 | < 15 | Kidney failure |
Disclaimer: This kidney function calculator is informational only and not a medical diagnosis. Estimates may be less accurate in pregnancy, acute illness, extremes of muscle mass or body size, and certain medication or diet conditions. Discuss results with your clinician.
Your rating helps improve Kidney Function Calculator. We store only an anonymized vote (no personal data).
How to Use Kidney Function Calculator
Step 1: Enter age and select biological sex
Type your age in years (18-120) and choose biological sex. The CKD-EPI 2021 equation uses both to estimate kidney filtration.
Step 2: Enter serum creatinine and pick units
Enter serum creatinine from your lab report. Switch between mg/dL and µmol/L — the calculator converts automatically. Results update instantly.
Step 3: Read your eGFR and CKD stage
Your eGFR (mL/min/1.73 m²) appears with a visual gauge and CKD stage (G1-G5). The reference table highlights your current stage row.
Step 4: Add ACR for KDIGO risk classification
Toggle ACR and enter your urine albumin-creatinine ratio (mg/g). The KDIGO heat map highlights your combined risk from Low to Very High.
Step 5: Copy results and discuss with your clinician
Use the Copy Summary button to save your eGFR, CKD stage, and risk level. Bring these numbers to your next appointment for context.
Key Features
- CKD-EPI 2021 eGFR without race coefficient
- CKD staging G1-G5 with active-row highlighting
- KDIGO risk heat map combining eGFR + ACR
- Creatinine in mg/dL or µmol/L with auto-conversion
- Optional absolute GFR via Mosteller BSA
- Copy summary for clinical notes
Understanding Your Kidney Function Results
The CKD-EPI 2021 Formula
This kidney function calculator uses CKD-EPI 2021, the current recommended equation for estimating GFR without a race coefficient. It compares your serum creatinine to a sex-specific reference (0.7 mg/dL for females, 0.9 for males), applies two power terms for values below and above that reference, and adjusts downward with age. For females, a small multiplier (1.012) is applied. The result is standardized to 1.73 m² body surface area, reported as mL/min/1.73 m².
CKD Stages and What They Mean
CKD stages group kidney function into six levels: G1 (eGFR ≥ 90, normal if no damage markers), G2 (60-89, mildly decreased), G3a (45-59), G3b (30-44), G4 (15-29, severely decreased), and G5 (below 15, kidney failure). KDIGO guidelines refine risk by combining the G stage with albuminuria categories: A1 (< 30 mg/g, normal), A2 (30-300 mg/g, moderate), and A3 (> 300 mg/g, severe). The heat map table in the calculator shows where your eGFR and ACR intersect. A single reading isn't definitive — CKD requires persistent changes over at least three months.
Assumptions and Limitations
eGFR is a population-based estimate. It's less reliable during pregnancy, acute kidney injury, extremes of muscle mass (bodybuilders, amputees), and for people taking medications that affect creatinine secretion (e.g., trimethoprim, cimetidine). If your eGFR doesn't match prior labs or clinical context, cystatin C-based equations or a measured creatinine clearance test may provide better accuracy. Always discuss unexpected results with your clinician.
Complete Guide: Kidney Function, eGFR, and CKD Staging

A kidney function calculator translates a routine blood test into an estimate of how well your kidneys filter waste — measured as eGFR (estimated glomerular filtration rate). For the roughly 37 million American adults living with chronic kidney disease, most diagnosed through exactly this kind of screening, knowing where you fall on the CKD stage spectrum can shape treatment decisions, medication dosing, and referral timing. This guide walks through the CKD-EPI 2021 formula, how CKD stages map to eGFR ranges, what ACR adds to the picture, and the practical factors that can shift your result.
What eGFR actually measures
Your kidneys contain about a million tiny filters called glomeruli. Together, they process roughly 180 liters of blood plasma daily, pulling out waste while retaining proteins and blood cells. The glomerular filtration rate (GFR) quantifies that flow in milliliters per minute. Directly measuring GFR requires injecting a tracer substance and collecting timed blood samples — impractical for routine care. So clinicians estimate it.
eGFR uses serum creatinine, a byproduct of normal muscle metabolism, as a proxy. Higher creatinine generally signals lower filtration, but the relationship isn't linear. The CKD-EPI equation accounts for age and sex to map creatinine to a filtration estimate that, across large populations, correlates reasonably well with measured GFR. It's not perfect for every individual — we'll cover the edge cases — but it's the best widely available screening tool.
The CKD-EPI 2021 formula explained
The 2021 update to CKD-EPI dropped the race coefficient that the 2009 version used, a change endorsed by the National Kidney Foundation and the American Society of Nephrology. The equation works like this: divide serum creatinine by a sex-specific constant (kappa: 0.7 for females, 0.9 for males), then apply two separate power terms — one for values below and one for values above that threshold. The exponent alpha is -0.241 for females and -0.302 for males. An age-decay factor of 0.9938 raised to the power of age reduces the estimate each year, reflecting normal age-related decline. For females, the result is multiplied by 1.012.
The output is indexed to 1.73 m² of body surface area, which means a person who is very large or very small may have a different actual filtration volume than the indexed number suggests. That's where the optional BSA adjustment in this calculator helps — it de-indexes the result to show absolute GFR in mL/min.
Worked example: calculating eGFR step by step
Consider a 55-year-old female with serum creatinine of 1.1 mg/dL. Here's how CKD-EPI 2021 processes those inputs:
| Step | Calculation | Result |
|---|---|---|
| 1. Divide Scr by kappa | 1.1 / 0.7 | 1.571 |
| 2. Min term (min of ratio, 1) | min(1.571, 1) | 1.000 |
| 3. Max term (max of ratio, 1) | max(1.571, 1) | 1.571 |
| 4. Apply powers | 1.000^(-0.241) × 1.571^(-1.2) | 1.0 × 0.582 |
| 5. Age factor | 0.9938^55 | 0.711 |
| 6. Combine | 142 × 0.582 × 0.711 × 1.012 | 59.5 mL/min/1.73 m² |
An eGFR of 59.5 places her in CKD stage G3a (mild-moderate decrease). If her ACR is below 30 mg/g (A1), the KDIGO grid classifies that combination as Moderate risk — enough to warrant monitoring but not necessarily an immediate referral to nephrology. Try entering these values in the calculator above to confirm.
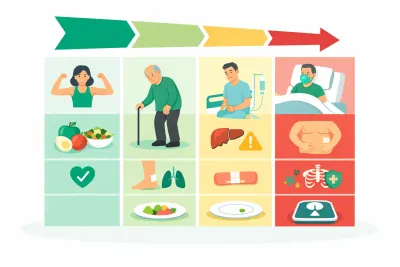
CKD stages G1 through G5
The six GFR categories, defined by KDIGO, group kidney function from normal to failure. Each stage carries different clinical implications:
| Stage | eGFR | Description | Typical action |
|---|---|---|---|
| G1 | ≥ 90 | Normal or high | Diagnose CKD only if damage markers present |
| G2 | 60–89 | Mildly decreased | Common with aging; monitor if risk factors |
| G3a | 45–59 | Mild-moderate decrease | Assess progression; adjust medications |
| G3b | 30–44 | Moderate-severe decrease | Refer to nephrology; avoid nephrotoxins |
| G4 | 15–29 | Severely decreased | Prepare for renal replacement therapy |
| G5 | < 15 | Kidney failure | Dialysis or transplant evaluation |
Stage alone doesn't tell the full story. A person at G2 with heavy proteinuria (A3) may need closer follow-up than someone at G3a with normal urine (A1). That's the whole rationale behind the KDIGO risk grid in the kidney function calculator — it cross-references both axes to give a more complete picture.
ACR, albuminuria, and the KDIGO risk grid
Albumin shouldn't appear in urine in significant amounts. When it does, it signals glomerular damage — the filters are leaking. The urine albumin-to-creatinine ratio (ACR) quantifies this: A1 means less than 30 mg/g (normal to mildly increased), A2 is 30-300 mg/g (moderately increased, often called "microalbuminuria"), and A3 exceeds 300 mg/g (severely increased or "macroalbuminuria"). A single elevated ACR should be confirmed on a repeat sample, ideally a first-morning void, since exercise, fever, and urinary tract infections can cause transient elevations. Heavy urinary albumin loss can also drag down your blood albumin; our albumin calculator grades how low the serum level has fallen and what it signals.
The KDIGO heat map combines GFR stage (G1-G5) with ACR category (A1-A3) into a risk grid: Low (green), Moderate (yellow), High (orange), or Very High (red). This matrix drives clinical decisions — referral thresholds, monitoring frequency, and medication targets. In the calculator above, entering both eGFR inputs and ACR highlights your exact cell in that grid.
eGFR vs. creatinine clearance: when it matters
Both estimate kidney function, but they're not interchangeable. eGFR (CKD-EPI) is indexed to a standard body size and used for CKD staging. Creatinine clearance (CrCl), typically estimated by Cockcroft-Gault, approximates actual filtration volume in mL/min and is still referenced by many drug labels — particularly for medications with narrow therapeutic windows like vancomycin (see our vancomycin dosing calculator), lithium, or direct oral anticoagulants. In practice, the two numbers may diverge significantly for people who are very small, very large, elderly, or have low muscle mass.
If your medication dosing references creatinine clearance, use the creatinine clearance calculator for the Cockcroft-Gault estimate. For CKD staging and risk classification, this kidney function calculator with CKD-EPI 2021 is the right tool. Our dedicated eGFR calculator offers the same formula with a streamlined single-purpose layout.
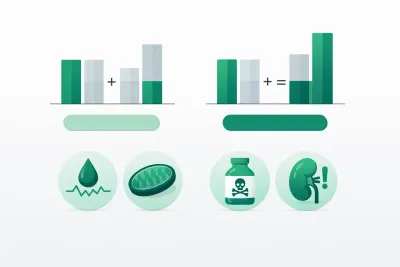
Kidney function calculator accuracy: what can throw off results
Creatinine-based eGFR works well for most adults in steady state. But several scenarios deserve caution:
- Acute kidney injury: Creatinine lags behind actual filtration changes by 24-48 hours. A rising creatinine may underestimate how much function has already dropped.
- Extreme muscle mass: Bodybuilders produce more creatinine, yielding artificially low eGFR. Conversely, sarcopenic elderly patients may show "normal" creatinine despite poor filtration.
- High-protein meals: A large meat meal the evening before a blood draw can bump creatinine by 10-20%. Fasting isn't required, but consistency matters.
- Medications: Trimethoprim, cimetidine, and cobicistat inhibit tubular creatinine secretion, raising measured creatinine without affecting actual GFR.
- Pregnancy: Increased blood volume and cardiac output raise GFR by 40-65%, making normal pregnancy creatinine values lower than non-pregnant ranges.
When creatinine-based estimates seem unreliable, cystatin C provides an independent check. It's produced by all nucleated cells (not just muscle), so it's less sensitive to body composition. The CKD-EPI 2021 also has a cystatin C-only and a combined creatinine-cystatin C version, though our calculator currently uses the creatinine-only equation since that's what most users have from their standard lab panel.
Tracking kidney function over time
One eGFR measurement is a snapshot. Kidney health is a trajectory. A clinically meaningful decline is generally defined as a sustained drop greater than 25% from baseline, or a decrease in eGFR category accompanied by a 25% or greater drop. Normal age-related decline averages about 0.7-1.0 mL/min/1.73 m² per year after age 40, so a small downward trend across years isn't necessarily pathological.
Practical tracking tips: use the same lab for consistency (assay methods vary), keep pre-test conditions similar (hydration, timing, exercise), and pair eGFR with ACR and blood pressure. For people with diabetes or hypertension, annual screening with both eGFR and ACR is standard guidance. If your care team starts an ACE inhibitor, ARB, or SGLT2 inhibitor, expect a small initial dip in eGFR — this often reflects hemodynamic changes rather than actual kidney damage, and typically stabilizes within weeks. Document your results with dates, lab names, and the creatinine value used. Many clinics provide online portals where you can download your lab history — having several data points makes it far easier for your clinician to distinguish a genuine trend from normal fluctuation.
For blood pressure context alongside your kidney numbers, try the blood pressure calculator. If you're tracking glucose for diabetes management, the A1C calculator converts between A1C and estimated average glucose.
Related calculators
- eGFR Calculator (CKD-EPI 2021) — streamlined eGFR estimation with CKD staging.
- Creatinine Clearance Calculator — Cockcroft-Gault CrCl for medication dosing.
- BUN/Creatinine Ratio Calculator — separates pre-renal causes like dehydration from intrinsic kidney damage.
- Blood Pressure Calculator — classify BP readings; hypertension is the second leading cause of CKD.
- A1C Calculator — A1C to eAG conversion for diabetes monitoring, the leading cause of CKD.
- BSA Calculator — body surface area for converting indexed eGFR to absolute GFR.
- Hydration Calculator — estimate daily fluid needs; relevant context for kidney health.
References
- Inker LA, Eneanya ND, Coresh J, et al. "New creatinine- and cystatin C-based equations to estimate GFR without race." N Engl J Med. 2021;385(19):1737-1749. NEJM
- KDIGO 2024 Clinical Practice Guideline for the Evaluation and Management of Chronic Kidney Disease. KDIGO
- National Kidney Foundation. "Estimated Glomerular Filtration Rate (eGFR)." NKF
This article is informational and does not constitute medical advice. Always discuss kidney function results and treatment decisions with your healthcare provider.

Written by Marko Šinko
Lead Developer
Computer scientist specializing in data processing and validation, ensuring every health calculator delivers accurate, research-based results.
View full profileFrequently Asked Questions
What does the kidney function calculator estimate?
This kidney function calculator estimates your eGFR (estimated glomerular filtration rate) using the CKD-EPI 2021 creatinine equation and maps the result to CKD stages G1 through G5. Adding your ACR shows combined KDIGO risk from Low to Very High.
How do I calculate my CKD stage?
Enter your age, sex, and serum creatinine into the calculator. Your CKD stage is determined by eGFR: G1 is 90 or above, G2 is 60-89, G3a is 45-59, G3b is 30-44, G4 is 15-29, and G5 is below 15 mL/min/1.73 m2. The KDIGO grid also uses ACR to refine risk.
What is a normal eGFR for kidney function?
An eGFR of 90 mL/min/1.73 m2 or higher is considered normal (stage G1) when there is no kidney damage. Values between 60 and 89 (stage G2) are mildly decreased but common with aging. Persistent eGFR below 60 for three or more months typically defines chronic kidney disease.
What is the difference between eGFR and creatinine clearance?
eGFR is standardized per 1.73 m2 of body surface area using equations like CKD-EPI 2021. Creatinine clearance (CrCl) estimates the actual volume of plasma cleared per minute without body size indexing, often using the Cockcroft-Gault formula. Some medication dosing references CrCl rather than eGFR.
Does this CKD calculator use a race coefficient?
No. This calculator uses CKD-EPI 2021, which removed the race coefficient present in the older 2009 equation. It relies only on age, biological sex, and serum creatinine to estimate eGFR.
What is ACR and why does it matter for CKD staging?
ACR (albumin-to-creatinine ratio) measures protein in your urine. Categories are A1 (below 30 mg/g, normal), A2 (30-300 mg/g, moderate), and A3 (above 300 mg/g, severe). Even with a normal eGFR, elevated ACR can indicate kidney damage and raise your KDIGO risk classification.
Can hydration, muscle mass, or diet affect kidney function results?
Yes. Creatinine is a byproduct of muscle metabolism, so heavy exercise, high meat intake, very low muscle mass, or dehydration can shift the reading. If a result seems unexpected, repeating the test under usual conditions often clarifies. Cystatin C offers an alternative when creatinine-based estimates are unreliable.
Is this kidney function calculator a medical diagnosis?
No. It provides an informational estimate, not a clinical diagnosis. Kidney disease classification requires confirmed results over time plus clinical context like blood pressure, imaging, and medications. Always discuss lab results with your clinician.
Related Calculators
A1C Calculator — Convert HbA1c to eAG with Targets
Use our A1C calculator to convert HbA1c to estimated average glucose (eAG). See normal, prediabetes, and diabetes thresholds in mg/dL and mmol/L. Fast results.
Albumin Calculator — Serum Albumin Level Interpretation
Free albumin calculator to interpret serum albumin levels, grade hypoalbuminemia, and compute A/G ratio plus albumin-corrected calcium from your lab results.
ANC Calculator — Free Neutrophil Count & Neutropenia Grade
Free ANC calculator: enter WBC and differential to get absolute neutrophil count in ×10^9/L and cells/µL with instant neutropenia grading and unit conversion.
Anion Gap Calculator — Metabolic Acidosis Evaluation
Free anion gap calculator finds serum anion gap from sodium, chloride, and bicarbonate, with albumin correction and delta ratio for metabolic acidosis.
AST/ALT Ratio Calculator — Free De Ritis Ratio Tool
Use our free AST/ALT ratio calculator to compute the De Ritis index instantly. Visual ratio chart, enzyme-level assessment, and clinical patterns guide.

Blood Pressure Calculator: Check BP Category by AHA
Use the blood pressure calculator to classify readings by AHA guidelines. See normal, elevated, and hypertension stages with explanations and practical tips.