CDC Child BMI Calculator — Enter Age, Sex, Height, and Weight
This pediatric BMI percentile calculator uses CDC growth chart references for ages 2–20 to show BMI, BMI-for-age percentile, z-score, and weight category. Results update instantly as you type.
CDC-based screening for ages 2\u201320.
BMI-for-Age Percentile
Between the 5th and 85th percentile
Boy, 10y
BMI 17.9 kg/m²
BMI
17.9
kg/m²
Z-Score
-0.33
standard deviations
Median BMI
18.4
50th pctile at 10y
Healthy Range
31.0–39.7
kg (5th\u201385th)
BMI at Key Percentiles \u2014 Boy, 10y
5th
15.8
50th
18.4
85th
20.2
95th
21.4
Your child's BMI of 17.9 is below the median (18.4) for this age.
CDC BMI-for-Age Reference \u2014 Boys
| Age | 5th | 50th | 85th | 95th |
|---|---|---|---|---|
| 2 years | 14.1 | 16.4 | 18.1 | 19.1 |
| 4 years | 13.6 | 15.8 | 17.4 | 18.4 |
| 6 years | 13.5 | 15.7 | 17.2 | 18.2 |
| 8 years | 14.4 | 16.8 | 18.5 | 19.6 |
| 10 years | 15.8 | 18.4 | 20.2 | 21.4 |
| 12 years | 16.9 | 19.6 | 21.5 | 22.7 |
| 14 years | 18.2 | 21.0 | 23.0 | 24.2 |
| 16 years | 19.0 | 21.9 | 23.9 | 25.2 |
| 18 years | 19.6 | 22.5 | 24.5 | 25.8 |
| 20 years | 20.0 | 22.9 | 24.9 | 26.2 |
BMI values in kg/m². Highlighted row is closest to child's age.
Underweight
<5th percentile
Healthy
5th–<85th
Overweight
85th–<95th
Obesity
≥95th
Screening tool only. BMI percentiles are estimated from CDC-style BMI-for-age curves using an offline LMS approximation (log-normal limit). This does not replace clinical assessment. Growth trends over time are more informative than a single reading. Discuss concerns with your child's pediatrician.
Your rating helps improve Child BMI Calculator — CDC Percentile by Age & Sex. We store only an anonymized vote (no personal data).
How to Use Child BMI Calculator — CDC Percentile by Age & Sex
Step 1: Select sex and enter age
Choose Male or Female, then type the child's age in the Years field (2-20) and any additional Months (0-11).
Step 2: Choose measurement units
Toggle between Metric (cm, kg) or US (ft/in, lb) depending on how you measured.
Step 3: Enter height and weight
Type the child's height and weight. Measure without shoes, standing tall against a wall, using a reliable scale.
Step 4: Read the BMI percentile result
The calculator instantly shows BMI, BMI-for-age percentile, z-score, CDC weight category, and the healthy weight range for that height and age.
Step 5: Review the reference table
Scroll down to compare your child's BMI against the 5th, 50th, 85th, and 95th percentile values at every age from 2 to 20.
Step 6: Copy or share results
Use the Copy Summary button to save results as text for your records or to share with your pediatrician.
Key Features
- CDC BMI-for-age percentile (ages 2-20)
- Metric and US imperial unit support
- Z-score and healthy weight range
- Color-coded CDC weight categories
- Reference table for boys and girls
- Instant results with no data sent to servers
Understanding Your Child's BMI Percentile Results
How the CDC BMI Formula Works
BMI is weight divided by height squared (kg/m²). The calculator converts feet/inches and pounds to metric automatically. For children ages 2–20, the raw BMI is then compared against CDC BMI-for-age growth chart references using the LMS method to produce a percentile that accounts for age and sex.
CDC Percentile Categories for Children
The CDC defines four weight-status categories based on BMI-for-age percentile: underweight (<5th percentile), healthy weight (5th–<85th), overweight (85th–<95th), and obesity (≥95th). The calculator also displays BMI values at key percentiles (5th, 50th, 85th, 95th) for your child's exact age and the healthy weight range for their height.
Assumptions & Limitations
BMI is a screening tool—it does not directly measure body fat, muscle mass, or body composition. Athletic children may have higher BMI from muscle. The percentile is based on CDC reference data from the year 2000 growth charts. Always look at trends over time and discuss concerns with a pediatrician rather than drawing conclusions from a single reading.
Complete Guide: Child BMI Calculator — CDC Percentile by Age & Sex

On this page
A child BMI calculator does something an adult BMI tool can't: it accounts for the fact that healthy body mass changes dramatically between ages 2 and 20. A BMI of 18 means one thing for a 6-year-old girl and something entirely different for a 16-year-old boy. That's why pediatric BMI is reported as a percentile rather than a fixed category—it compares your child's number against thousands of same-age, same-sex peers from the CDC growth chart reference population.
This guide walks through the CDC percentile system, shows a full worked example, explains when BMI tells the whole story (and when it doesn't), and covers the most common measurement mistakes parents make. If you're here because your pediatrician mentioned a percentile number, the context below should help you interpret it.
Why BMI percentiles matter for children
Adults get a simple threshold: BMI over 25 is overweight, over 30 is obese. For kids, those numbers are meaningless. A 4-year-old's median BMI is around 15.7, while a 17-year-old boy's is about 22.2. If you applied the adult scale to a preschooler, nearly every child would look “underweight.”
Percentiles solve this by ranking a child's BMI within an age- and sex-matched reference group. The 70th percentile means the child's BMI exceeds 70% of peers and falls below 30%. It's a relative position, not an absolute judgment. Clinicians rely on percentile trends over months and years—a single reading is just a snapshot.
CDC BMI categories for children and teens
The CDC defines four weight-status categories for ages 2–20 based on BMI-for-age percentile. These are screening thresholds, not diagnoses:
| Category | Percentile Range | What It Means |
|---|---|---|
| Underweight | <5th percentile | BMI lower than 95% of same-age peers; may warrant nutrition review |
| Healthy weight | 5th to <85th | Within the expected range for age and sex |
| Overweight | 85th to <95th | Higher than most peers; pediatrician may monitor trends |
| Obesity | ≥95th | Well above peers; clinical follow-up typically recommended |
The CDC also recognizes “severe obesity” at ≥120% of the 95th percentile BMI or ≥35 kg/m², whichever is lower. For most families, though, the four-band system above is what the pediatrician will reference.
How the child BMI calculator works
Step one is the same for any BMI tool: divide weight (kg) by height (m) squared. If you enter feet, inches, and pounds, the calculator converts behind the scenes—1 inch = 0.0254 m, 1 lb = 0.4536 kg—so the formula is identical.
Step two is where it diverges from adult tools. The raw BMI is fed into an LMS model (Lambda-Mu-Sigma), which describes how BMI is distributed at each month of age for boys and girls separately. In the log-normal limit (L ≈ 0), the z-score is simply ln(BMI / M) / S, where M is the median BMI for that age-sex group and S captures the spread. The z-score maps to a percentile via the standard normal CDF.
This is the same statistical backbone the CDC uses in its own growth chart data files. Our implementation uses smoothed, offline LMS parameters so the tool runs entirely in your browser—no data leaves your device.
Worked example: step-by-step calculation
Let's walk through a concrete case. Suppose you have a 10-year-old boy who is 140 cm tall and weighs 35 kg.
- Calculate BMI: 35 ÷ (1.40)² = 35 ÷ 1.96 = 17.9 kg/m²
- Look up reference values: For a 10-year-old boy, the median BMI (M) is approximately 18.4 and S is about 0.092.
- Compute z-score: z = ln(17.9 / 18.4) / 0.092 = ln(0.9728) / 0.092 = −0.0276 / 0.092 ≈ −0.30
- Convert to percentile: The standard normal CDF at z = −0.30 gives roughly the 38th percentile.
- Classify: The 38th percentile falls in the Healthy Weight band (5th–<85th).
At this age, the 5th-percentile BMI is about 14.0, the 85th is around 20.2, and the 95th is near 22.1. So a BMI of 17.9 sits comfortably within the healthy range. To put it in weight terms, the healthy range for a 140 cm boy at age 10 is roughly 27–40 kg.
BMI vs. body fat in children: what BMI actually measures
BMI is a ratio of weight to height—nothing more. It doesn't distinguish fat from muscle, bone, or water. A muscular 14-year-old swimmer might land at the 90th percentile without carrying excess fat. Conversely, a child at the 60th percentile could have higher body fat if they're relatively inactive and have low muscle mass.
Research published in Pediatrics found that BMI correctly identifies obesity (confirmed by DXA scan) in about 76% of children, but misses it in the other 24%—mostly kids with high body fat but a BMI below the 95th percentile. For a more complete picture, consider waist circumference, skinfold measurements, or our Body Fat Percentage Calculator for older teens.
How age and sex affect BMI percentiles
BMI follows a predictable curve during childhood. It drops from around 16.4 at age 2 to a nadir near 15.6 at ages 4–5 (the “adiposity rebound”), then rises steadily through puberty. Boys and girls track similarly until about age 10, when puberty timing starts to diverge. Girls typically enter puberty earlier, accumulate more body fat proportionally, and reach a plateau sooner—around age 17–18. Boys keep climbing slightly until 19–20.
This is why the calculator asks for both age and sex. A BMI of 21 at age 12 is the 85th percentile for a girl but roughly the 90th for a boy at the same age. The difference comes from the distinct reference curves, not from the formula.
If you're also tracking height, our Child Height Percentile Calculator uses the same age-sex reference approach. For infants under 2, the Baby Weight Percentile Calculator uses WHO growth standards instead of CDC charts. And because BMI-for-age only applies once a child is measured standing, infants under 2 use its recumbent equivalent—the Weight-for-Length Percentile Calculator.
Tracking growth over time: why trends beat single readings
Pediatricians don't panic over one percentile number. They look at the trajectory. A child who's been tracking at the 75th percentile for years is growing normally even though 75 sounds “high.” What triggers concern is a rapid crossing of percentile lines—jumping from the 50th to the 90th in 12 months, or dropping from the 40th to the 5th.
Practical tracking tips:
- Measure every 3–6 months at the same time of day, same scale, shoes off.
- Record results in a journal or app. Plot them on a growth chart to visualize the curve.
- Don't compare siblings. Each child has their own growth pattern influenced by genetics, puberty timing, and activity level.
- Watch for the adiposity rebound (age 4–6). An early rebound—BMI increasing before age 5—is associated with higher obesity risk later.
For a broader growth picture, the Child Growth Calculator lets you track weight, height, and BMI percentiles together. And once your child turns 20, switch to the Adult BMI Calculator which uses fixed categories rather than age-adjusted percentiles. Parents who want to understand where BMI came from and how to read the categories can also read our comprehensive guide to understanding BMI.
Common mistakes when checking child BMI
Even small errors in measurement or data entry can shift a percentile dramatically, especially in the steep tails of the distribution:
- Rounding height down. Slouching during measurement or rounding 137.5 cm to 137 cm inflates BMI. Always measure against a wall, head level, heels together.
- Weighing with heavy clothes or shoes. A winter coat and boots can add 1–2 kg, enough to push a borderline child from the 83rd to the 87th percentile (across the overweight threshold).
- Entering the wrong age. Forgetting to include months matters. A 10-year-0-month child has a lower median BMI than a 10-year-11-month child. Off by a year? The percentile could shift 5–10 points.
- Using an adult BMI calculator. Adult tools report fixed categories (25 = overweight). That threshold is meaningless for a 7-year-old whose healthy median BMI is 16.1. Always use an age-adjusted pediatric tool.
- Overreacting to a single reading. One percentile number after a holiday meal or a growth spurt doesn't define a pattern. Track trends over at least 6–12 months before drawing conclusions.
References
- Centers for Disease Control and Prevention. CDC Growth Chart Percentile Data Files. Accessed 2025.
- Kuczmarski RJ, et al. “2000 CDC Growth Charts for the United States: Methods and Development.” Vital Health Stat. 2002;11(246):1–190.
- Freedman DS, et al. “The relation of BMI and skinfold thicknesses to risk factors among young adults.” Pediatrics. 2009;124(Suppl 1):S23–S34.
- MedlinePlus. Body mass index in children.
This page is for informational and educational purposes only. It does not provide medical advice and is not a substitute for guidance from your child's pediatrician or healthcare provider.

Written by Marko Šinko
Lead Developer
Computer scientist specializing in data processing and validation, ensuring every health calculator delivers accurate, research-based results.
View full profileFrequently Asked Questions
What ages does the CDC child BMI calculator cover?
This child BMI calculator covers ages 2 through 20 years using CDC BMI-for-age reference data. Infants under 2 use separate WHO growth standards, which you can check with our Baby Weight Percentile Calculator.
What does a BMI percentile mean for a child?
A BMI percentile compares your child to thousands of same-age, same-sex peers from CDC reference data. The 70th percentile means the child has a higher BMI than 70% of peers. Unlike adult BMI, children use percentiles because healthy BMI changes with age.
What BMI percentile is considered healthy for children?
The CDC defines four categories: underweight is below the 5th percentile, healthy weight is the 5th to less than 85th, overweight is the 85th to less than 95th, and obesity is at or above the 95th percentile for age and sex.
How is child BMI percentile calculated?
First, BMI is calculated as weight in kg divided by height in meters squared. Then, the LMS method compares that BMI to age- and sex-specific CDC reference curves to produce a z-score, which converts to a percentile via the standard normal distribution.
Is this the same as the CDC BMI calculator?
This calculator uses the same statistical method (LMS with log-normal approximation) and CDC BMI-for-age reference curves as official tools. It runs entirely in your browser with no data sent to any server, making it a private and convenient screening option.
Does BMI measure body fat in children?
No. BMI is a ratio of weight to height and does not directly measure body fat, muscle, or bone mass. A muscular child may have a high BMI percentile without excess fat. BMI is a screening tool best used alongside clinical assessment.
How often should I check my child BMI percentile?
Every 3 to 6 months is typical. Use consistent methods: same scale, shoes off, same time of day. Growth trends over multiple readings are far more informative than any single percentile number.
What is the difference between child BMI and adult BMI?
Adult BMI uses fixed thresholds (25 for overweight, 30 for obesity) that do not change with age. Child BMI uses age- and sex-specific percentiles because healthy BMI shifts as children grow. A BMI of 18 is normal for a 6-year-old but would be underweight for a 16-year-old.
Related Calculators
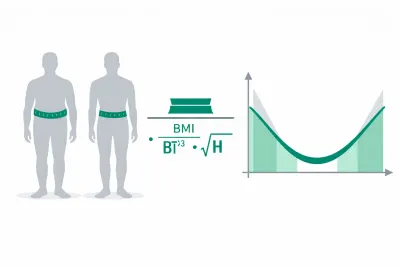
ABSI Calculator: A Body Shape Index & Mortality Risk
Free ABSI calculator computes A Body Shape Index from waist, height, and BMI to estimate visceral fat and mortality risk independent of body mass index.

Adult BMI Calculator for Men & Women — WHO BMI Guide
Use the adult BMI calculator to find your BMI with WHO categories. Enter metric or imperial units to see your status and BMI ranges quickly and clearly.

Army Body Fat Calculator — AR 600‑9 Standard Compliance
Check compliance with the Army body fat calculator per AR 600-9 standards. Enter circumference measures by sex to estimate body fat % and see pass/fail status.
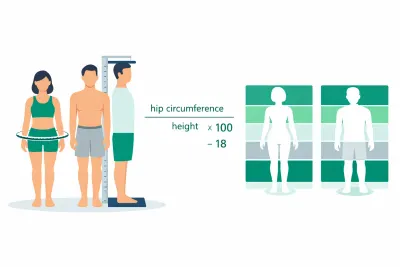
Body Adiposity Index Calculator (BAI) — Body Fat %
Free body adiposity index calculator estimates body fat percentage from hip circumference and height using the BAI formula, no weight or scale needed.

Body Composition Calculator — Fat, Lean Mass Breakdown
Use our body composition calculator to estimate body fat percentage, fat mass, and lean mass from tape measurements. Switch units and get clear categories.

Body Fat Calculator — Percentage for Men & Women (Tape)
Estimate with the body fat percentage calculator (body fat calculator) using Navy circumference equations. Supports metric/imperial and sex‑specific inputs.